Extend CELUS with advanced analytics.

Access your CELUS usage data in BI tools with CELUS Data Hub

  • Combine usage with financial data
  • Create executive dashboards
  • Integrate data into institutional BI tools (MS Power BI, Metabase, Tableau, APACHE Superset,...)
  • Run custom SQL queries
  • Automate internal reporting pipelines
Request Data Hub Access

Data Hub gives you full analytical control without leaving the CELUS ecosystem.
Available as an add-on to active CELUS subscriptions.

What is CELUS Data Hub?

CELUS Data Hub is your bridge between usage stats and other data.

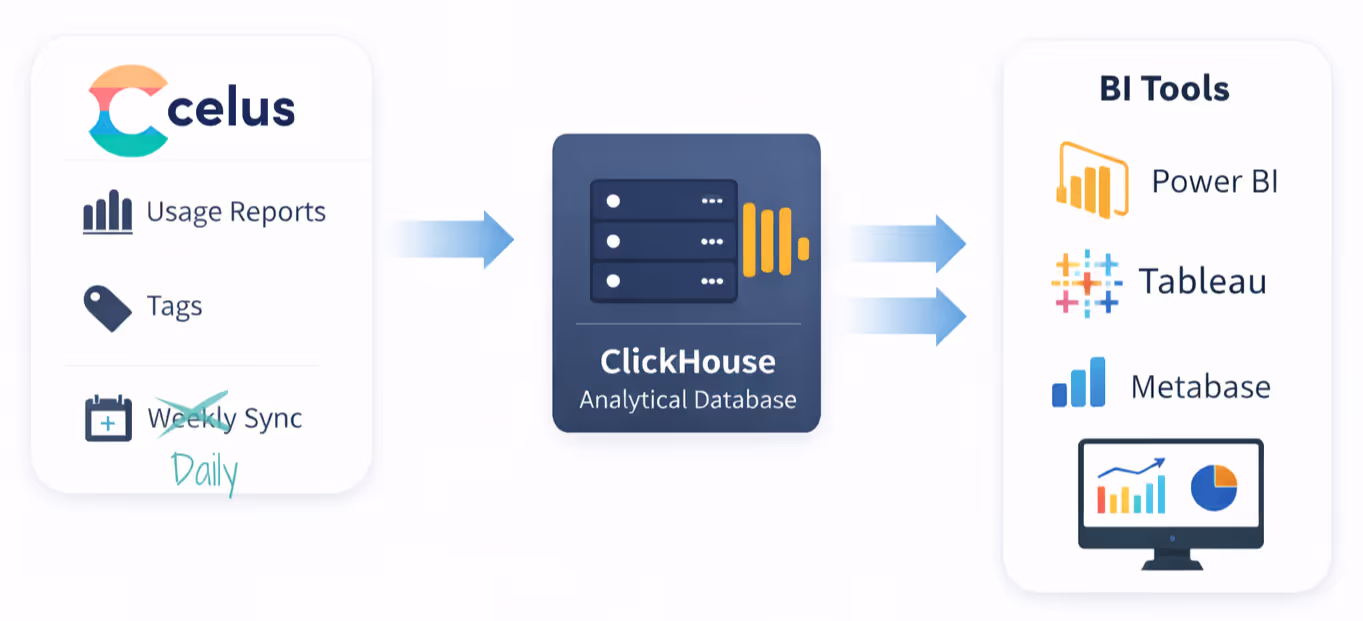
It exports your usage data into a dedicated analytical database running on CELUS infrastructure (Clickhouse). The database is separate from your main CELUS account and provides secure access credentials for BI tools and SQL clients. All your usage data and tag information is synchronized with the Data Hub on a daily basis with the option of immediate manual synchronization.

For exploration and testing, it offers a simple web interface where you can explore the database structure and run queries on your data.

What is the structure of the data?

Each report from your CELUS instance is stored in a separate table in the database.

For example, if you are harvesting TR, DR and PR reports, you will have three tables named TR, DR and PR.

COUNTER 5.1 reports have their own tables. 
To make the transition between COUNTER R5 and R5.1 seamless, we also provide merged tables for TR, DR, PR and IR_M1 reports, where data are merged on a month-by-month basis. Data from R5.1 are used preferentially with fallback to R5 when R5.1 data are not available.

Non-COUNTER reports are exported as well, each as a separate table.

Tags are exported separately into tables title_tags and platform_tags. These tables may be joined together with the report tables to get usage by tags.

What libraries are building with Data Hub

Data Hub enables institutions to create fully customized dashboards tailored to their internal needs. Below are examples of real dashboards created using CELUS Data Hub.

Executive usage overview

Executive dashboard for strategic reporting

  • Total usage overview
  • Time-based filtering
  • KPI tiles for quick reporting
  • Platform-level filtering

Why it matters:

Perfect solution for reporting to university leadership or funding bodies.

Usage by Year of Publication

Collection age analysis

  • Usage by year of publication
  • Access type segmentation
  • Title tag filtering (e.g. Computer Science)
  • Identification of backfile value

Why it matters:

Supports evidence-based collection development and renewal decisions.

Platform comparison & access model analysis

Platform and access model comparison

  • Compare platforms (EBSCO, JSTOR, ProQuest…)
  • Analyze Controlled vs Open vs OA_Gold
  • Filter by year / quarter
  • Identify trends across time

Why it matters:

Helps optimize subscriptions and negotiate licenses.

How Coventry University uses CELUS Data Hub

At Coventry University, COUNTER data are used almost daily - for measuring collection usage, evaluating renewals, considering new purchases, and assessing the impact of  library services on the student experience.

The Problem

Working with COUNTER tabular reports in Power BI required significant manual effort. Even with report aggregators like JUSP, collecting and preparing datasets at scale was time-consuming and inefficient.

Importing hundreds of tabular reports meant:

  • Heavy manual preprocessing
  • Complex transformations before analysis
  • Limited agility when new data arrived
Download the full mini case study

The Transformation

Data Hub changed that completely.

For Coventry, the ability to query the ClickHouse analytical database and retrieve data for all platforms in a single transaction was described as transformational.

Instead of importing hundreds of tabular reports:

"A few SQL queries will sort and pull the data needed."

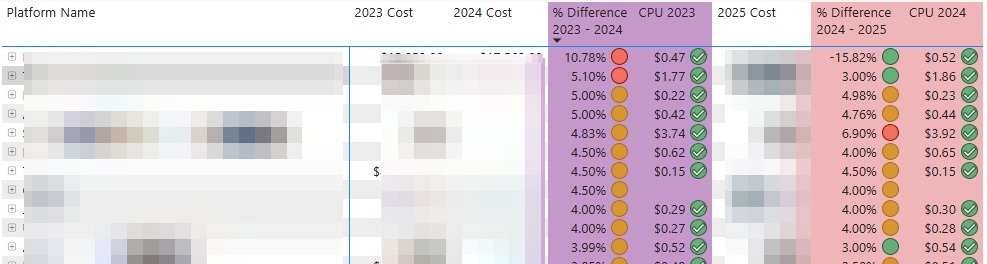
The data now flows into Power BI:

  • Ready to be queried
  • With minimal transformation required
  • Easily refreshable as new data become available
  • Embedded directly into strategic planning workflows

What they built with Data Hub

Executive overview dashboard
  • Cross-filterable by platform
  • Comprehensive eResources usage overview
Longitudinal journal usage analysis
  • Usage trends over time
  • Filterable by access type and platform
  • Includes COUNTER 5.1 datasets
Year of Publication (YOP) analysis
  • Identifies which platforms generate usage
  • Evaluates legacy collections
  • Supports subscription review decisions
Title-level and subject-level analysis
  • Journal usage by title
  • Scopus subject area breakdown
  • Insight into long-tail usage across collections

Pricing

We prioritize transparent and affordable pricing while supporting CELUS development and maintenance.

Pricing is based on the number of publisher platforms (COUNTER and non-COUNTER) you manage.

Publisher platforms CELUS EURUSD/year CELUS + Data Hub +20%
1 – 25 €2,000$2,300 €2,400$2,760
26 – 50 €2,500$2,900 €3,000$3,480
51 – 75 €3,000$3,500 €3,600$4,200
76 – 100 €3,500$4,100 €4,200$4,920
101 – 150 €4,000$4,700 €4,800$5,640
151 – 200 €5,000$5,800 €6,000$6,960
201+ Request a quote Request a quote

CELUS Data Hub

Advanced analytics add-on. Access your CELUS usage data in BI tools — full analytical control without leaving the CELUS ecosystem.

  • Combine usage with financial data
  • Create executive dashboards
  • BI tool integration (Power BI, Tableau, Metabase…)
  • Custom SQL queries
  • Automated reporting pipelines

Explore CELUS with a 42-day free, non-binding trial — no credit card needed.

Get started →