Can I do a Cost-per-use analysis in CELUS?

Yes. CELUS has a built-in cost-per-use (CPU) view for platforms, where you enter what you paid for each platform and CELUS divides it by the usage it already has. For deeper analysis, for example cost per use of individual packages, collections or titles, you can combine CELUS data with Excel, Power BI (through CELUS Data Hub), or ConsortiaManager. This article walks you through all four options, so you can pick the one that fits your needs.

Option 1: Platform-level cost per use in CELUS

Cost per use lives on the Platforms page, behind the dollar sign ($) icon in the top right corner of the platform table.
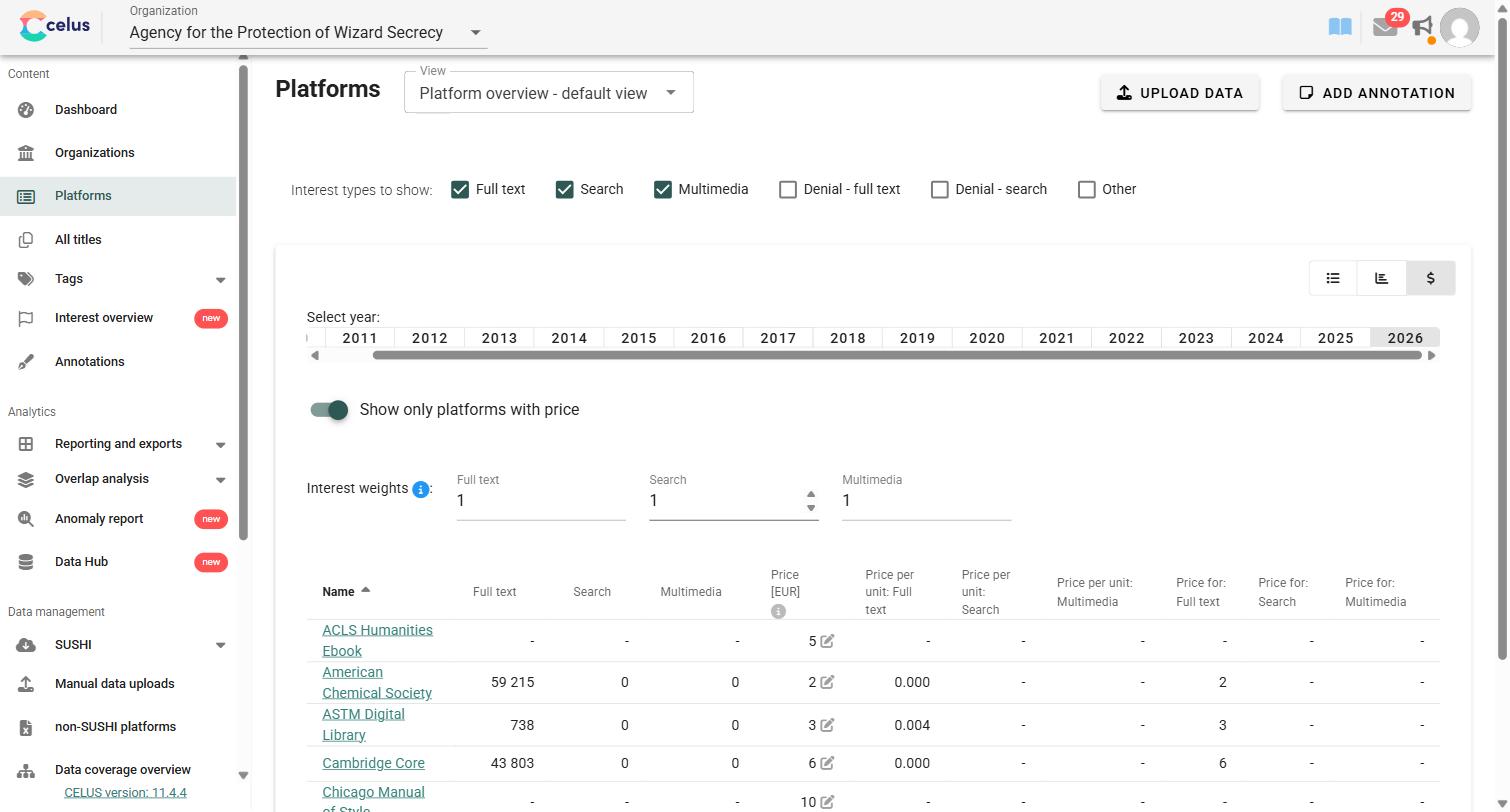
  1. Go to Platforms and click the $ icon above the table.
  2. Under Select year, choose the year you want to analyze.
  3. Click the pencil icon next to a platform's Price, enter the annual price for that platform and click Save. Enter prices without VAT. A price is stored for one organization, one platform and one year.
  4. Optionally, switch on Show only platforms with price to hide platforms you have not priced yet.
CELUS Platforms page with the cost per use ($) view open, showing the year selector, Show only platforms with price toggle, Interest weights, and price per unit columns

For each priced platform, CELUS then shows:

  • Price per unit (Full text, Search, Multimedia): the price divided by the usage of that interest type. This is your cost per use.
  • Price for (Full text, Search, Multimedia): how the platform's price is split between interest types when a platform has more than one. By default, the split follows the share of usage. In the screenshot, the 10 EUR paid for Sashimi Ebooks is split into 6 EUR for full text and 4 EUR for search.
  • Interest weights: if some types of use matter more to you than others, change the weights to shift more of the price onto them. For example, a full-text weight of 2 counts each full-text request twice as much as a search when the price is split.

You can also use the Interest types to show checkboxes at the top of the page to decide which kinds of usage (for example, Denial or Other) are included.
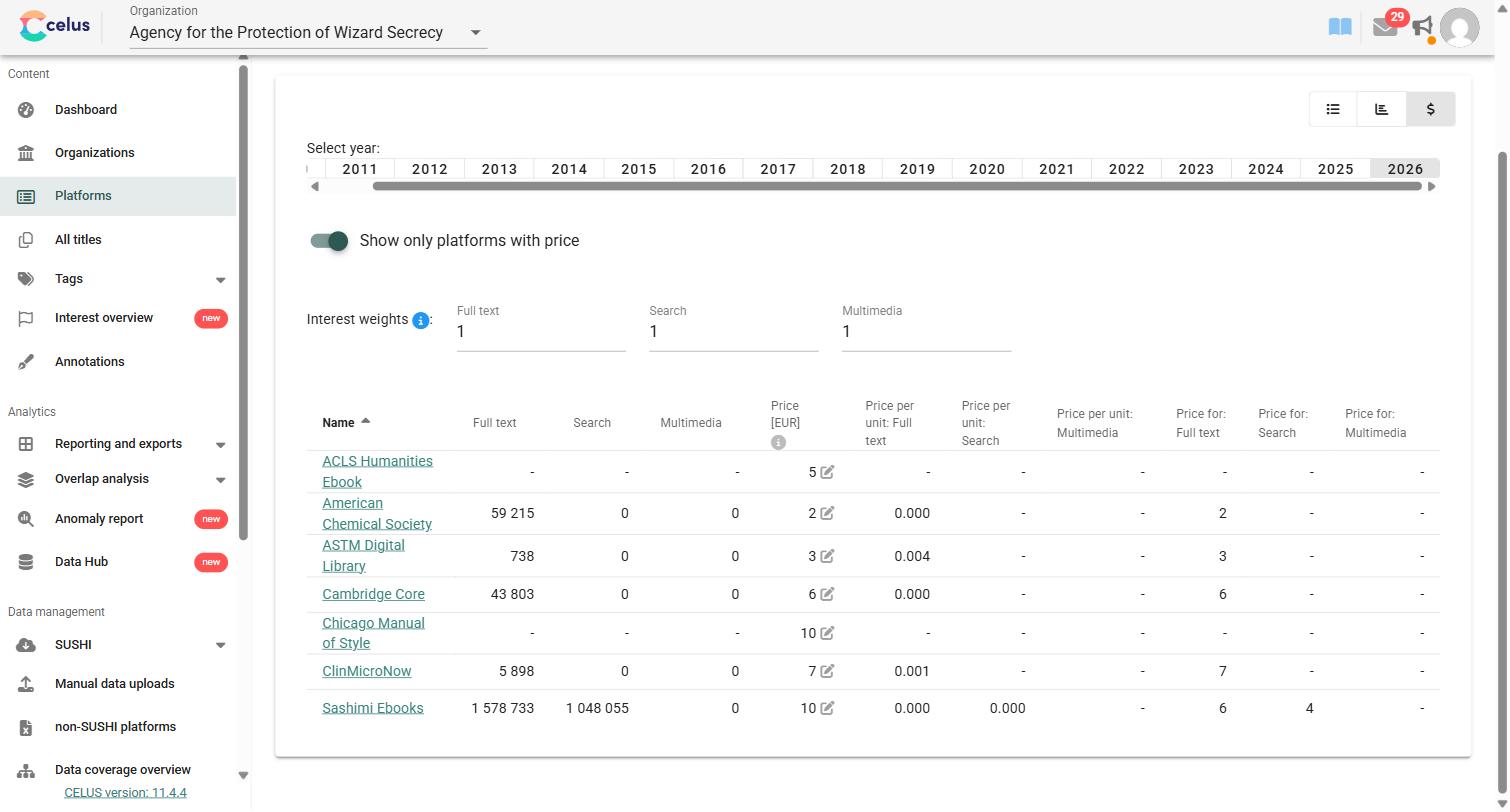
CELUS cost per use table for 2026 showing platforms with prices, price per unit, and how the price of Sashimi Ebooks is split between full text and search

Good to know: this module works at platform level only. You enter one price per platform and year manually, and you cannot assign costs to individual journals, packages or collections. If you need that, use one of the options below.

Option 2: Title- or collection-level cost per use in Excel

If you want cost per use for a specific package or collection, CELUS can prepare the usage and you add the costs in Excel:

  1. Tag the titles that belong to the package or collection (for example, all titles in your Big Deal).
  2. Go to Reporting and exports → Create report, choose the report type (for example, COUNTER 5.1 – Title Report), set the rows and filters you need, and check Merge rows by tag if you want one row per tag.
  3. Export the report and add your costs in Excel to calculate cost per use.

We walk through this workflow step by step, including common mistakes, in the recording of Cost-per-Use in CELUS #1: From Costs to Collection Decisions (with Excel). See also How to use Tags in CELUS.

Option 3: Dynamic cost per use in Power BI with CELUS Data Hub

If you need interactive dashboards, fiscal-year logic, or cost per use that updates automatically as new usage arrives, you can connect CELUS to Power BI through CELUS Data Hub, our optional advanced-analytics add-on. You then combine the usage data with your cost data using Power BI measures.

See the recording of Cost-per-Use in CELUS #2: Dynamic Cost per Use in Power BI with CELUS Data Hub and the article How to connect CELUS to Power BI (Data Hub).

Option 4: CELUS and ConsortiaManager

If you use ConsortiaManager, CELUS supplies the usage data and ConsortiaManager holds your agreements, prices and the titles covered by each agreement. Together they give you agreement-level and title-level cost per use that you can compare across your whole portfolio, including non-COUNTER resources.

To see how this works in practice, watch Cost per use you can actually defend, our joint webinar with ConsortiaManager.

Which option should I choose?

  • Quick overview of what each platform costs per use: Option 1, directly in CELUS.
  • One-off analysis of a package or collection: Option 2, CELUS and Excel.
  • Recurring, interactive reporting across many resources: Option 3, Data Hub and Power BI.
  • Agreement and cost data already managed in ConsortiaManager: Option 4.

Not sure which one fits your library? Shoot us a message at ask@celus.net and we'll help you choose.


‍

No items found.